- grafana.com
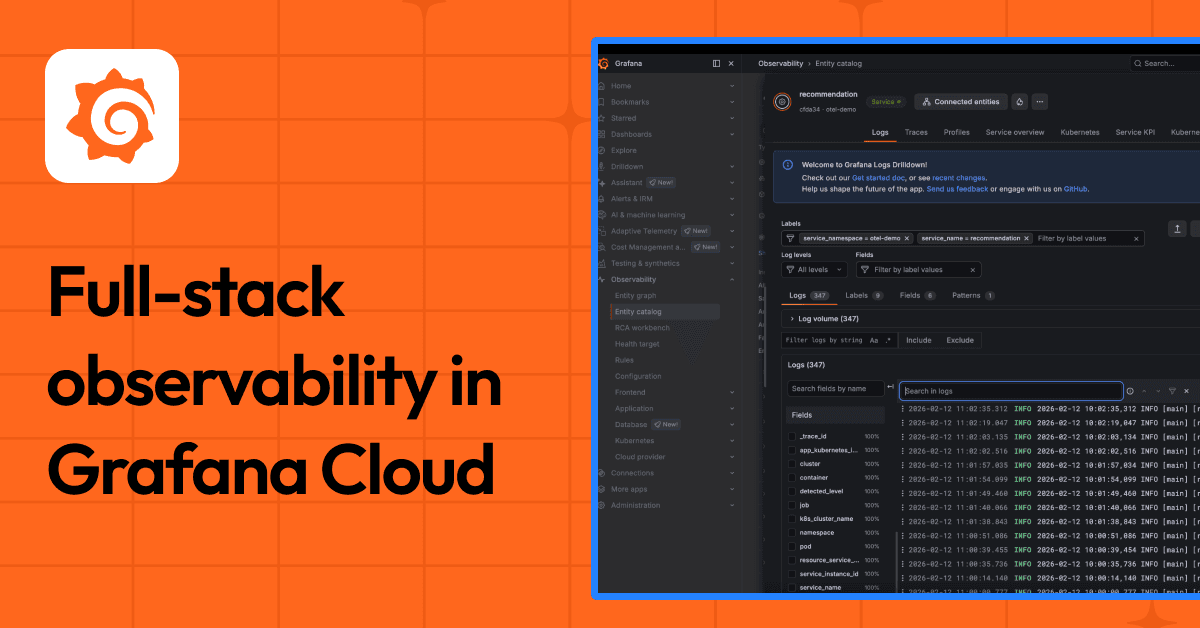
Full-stack observability in Grafana Cloud: How to investigate issues across services and infrastructure
- Eventgrafana.com
How to monitor AI agents in production with Grafana AI Observability (EMEA Timezone)
Grafana Labs held a live webinar on June 25, 2026, demonstrating how Grafana AI Observability helps monitor AI agents in production by tracing workflows, tracking token costs, and running online evalu…
- grafana.com
Grafana 13.1 release: observability as code updates, extending Grafana Assistant across more data sources, and more
Grafana 13.1 introduces major Git Sync improvements for observability-as-code, including root-level dashboard sync, README.md visibility by default, and automatic commit signing. It also expands Grafa…
- Eventgrafana.com
Intro to Application and Frontend Observability with Grafana Cloud
Grafana hosted a webinar on June 24, 2026, introducing its new Application and Frontend Observability solutions in Grafana Cloud. The session highlighted unified monitoring of application and frontend…
- Securitygrafana.com
Post-incident review for TanStack npm supply chain ransom incident: No unauthorized access to customer production systems
Grafana Labs completed an investigation into a May 11 supply chain ransom incident targeting their GitHub environment, confirming no unauthorized access to customer production systems or Grafana Cloud…

- Eventgrafana.com
How to get started with OpenTelemetry and Grafana (EMEA Timezone)
Grafana Labs hosted a webinar on June 19, 2025, demonstrating how to instrument applications with OpenTelemetry and leverage Grafana Cloud for AI-ready observability workflows. The session highlighted…
- Eventgrafana.com
ObservabilityCON 2026 is coming to San Francisco!
Grafana Labs announced ObservabilityCON 2026 will be held in San Francisco from October 19–21, 2026, at Pier 27, focusing on AI-era observability innovations. Early registration is open with limited 5…
- Eventgrafana.com
Performance testing and observability in Grafana Cloud
Grafana hosted a webinar on June 10, 2026, demonstrating how Grafana Cloud’s k6, Frontend Observability, and Synthetic Monitoring tools help teams test and monitor user journeys. The session highlight…
- Featuregrafana.com
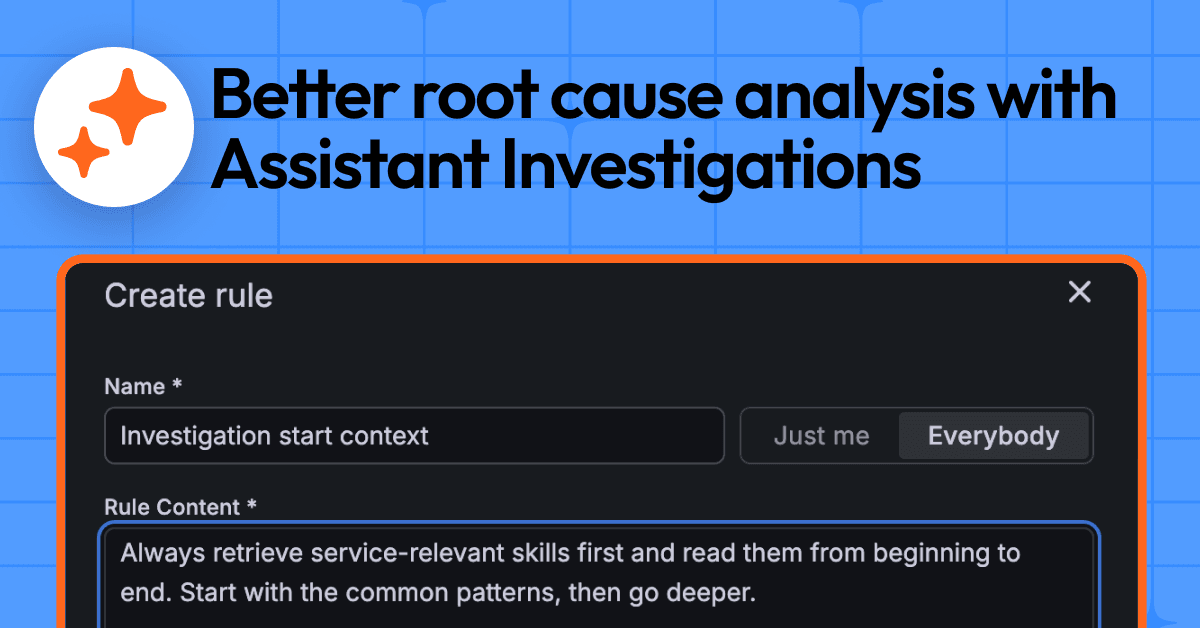
Automatically discover and remediate root causes with Grafana Assistant Investigations
Grafana Assistant Investigations, an AI-powered feature in Grafana Cloud, received a major upgrade to improve root-cause discovery and remediation in observability workflows. The update enables multi-…
- Eventgrafana.com
How to build advanced dashboards in Grafana
Grafana Labs hosted a webinar on June 4, 2026, focused on advanced dashboard-building techniques in Grafana, including data transformations, variables, Scenes library, drilldown links, and annotations…
- grafana.com
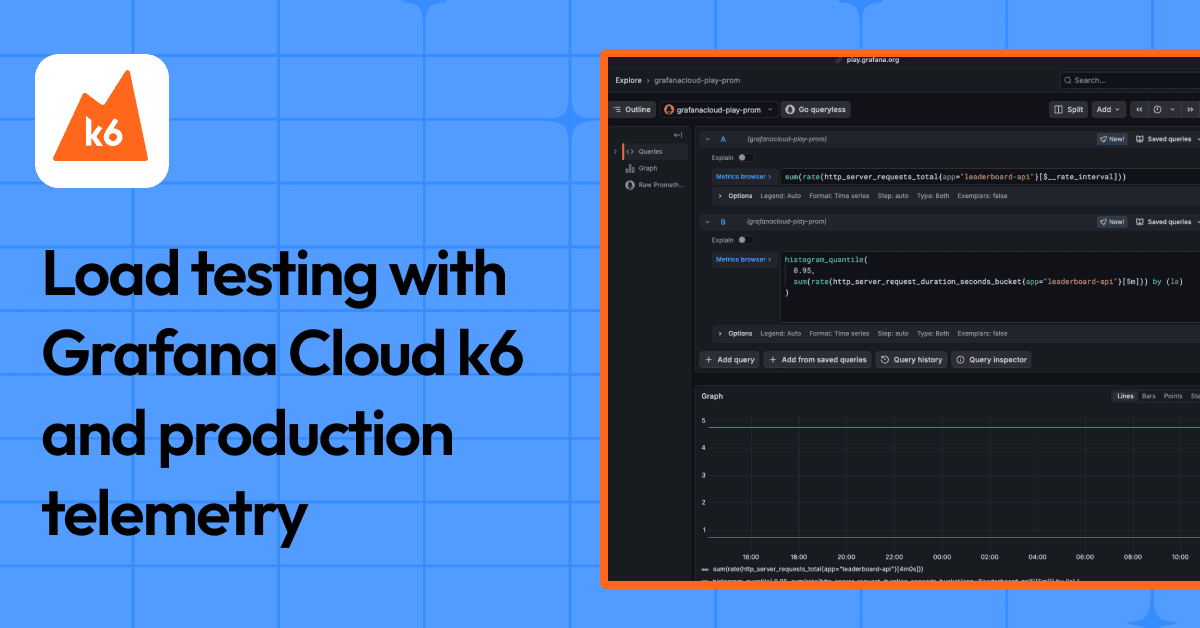
How to generate real-world load tests using Grafana Cloud k6 and production telemetry
Grafana Cloud k6 introduces a method to generate realistic load tests by leveraging production telemetry from Grafana Cloud dashboards. Instead of relying on assumptions, teams can now pull real reque…
- grafana.com
Pricing change detected for Grafana
Pricing updated for Grafana: - New tier: Grafana Cloud Free ($0/mo) - New tier: Grafana Cloud Pro (Platform Fee) ($19/mo) - New tier: Grafana Cloud Enterprise (Metrics) (Custom pricing) - New tier: Gr…
- Launchgrafana.com
Tempo 3.0 release: a new architecture for scale and lower TCO, TraceQL metrics GA, and more
Grafana released Tempo 3.0, a major update to its open-source distributed tracing backend, introducing a Kafka-compatible architecture to reduce storage costs and improve scalability. The release also…
Track Grafana on autopilot
- · Weekly AI brief — narrative summary of what shipped, every Monday 9 AM
- · Email or Slack alerts, or chat with the archive in your dashboard
- · Add Grafana + up to 2 more competitors free, no credit card